Увлекательные презентации Mike Brittain o Metrics Driven Engineering в компании Etsy
1. Metrics Driven Engineering
2. Metrics Driven Engineering
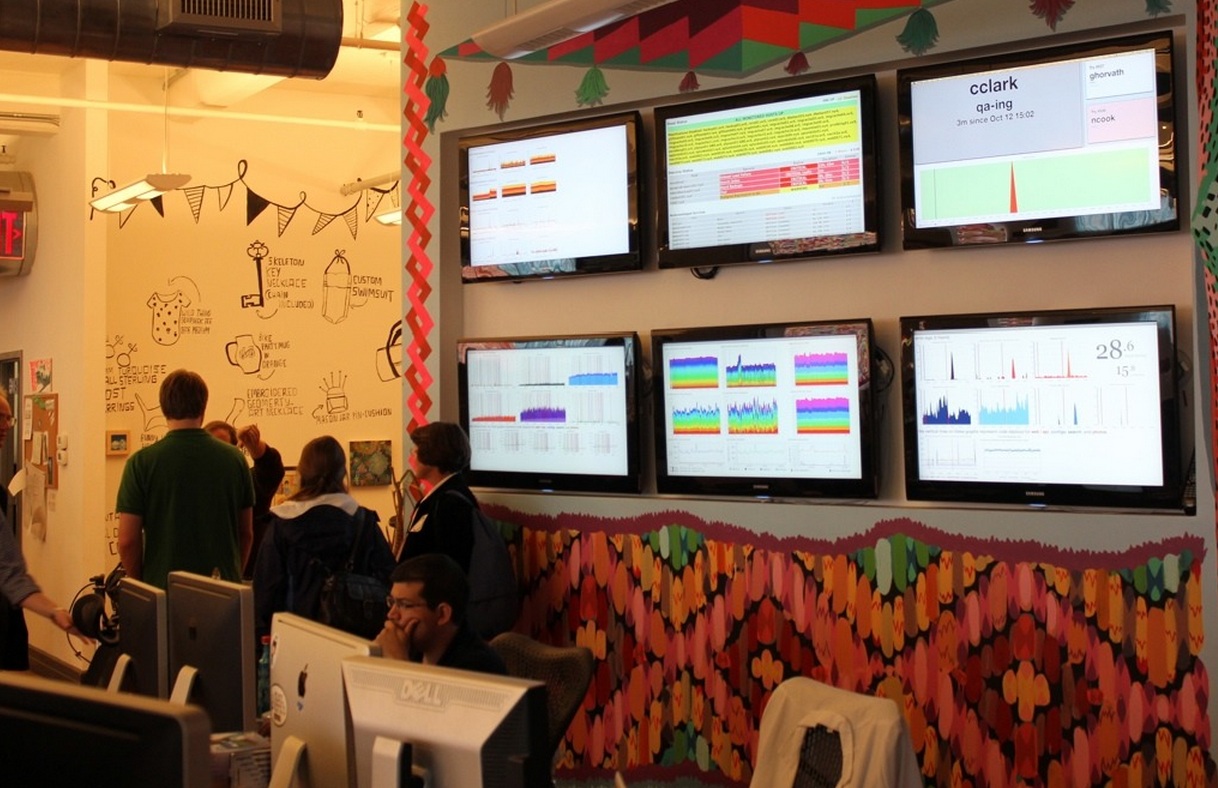
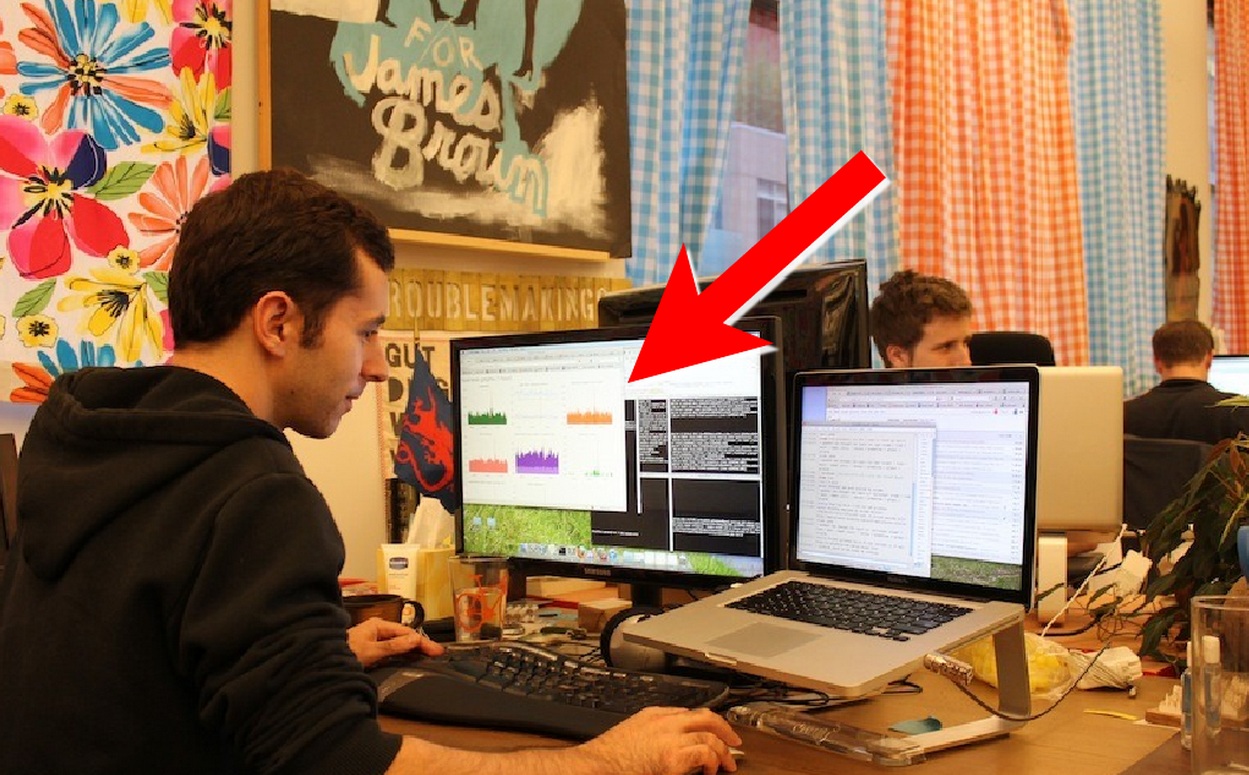
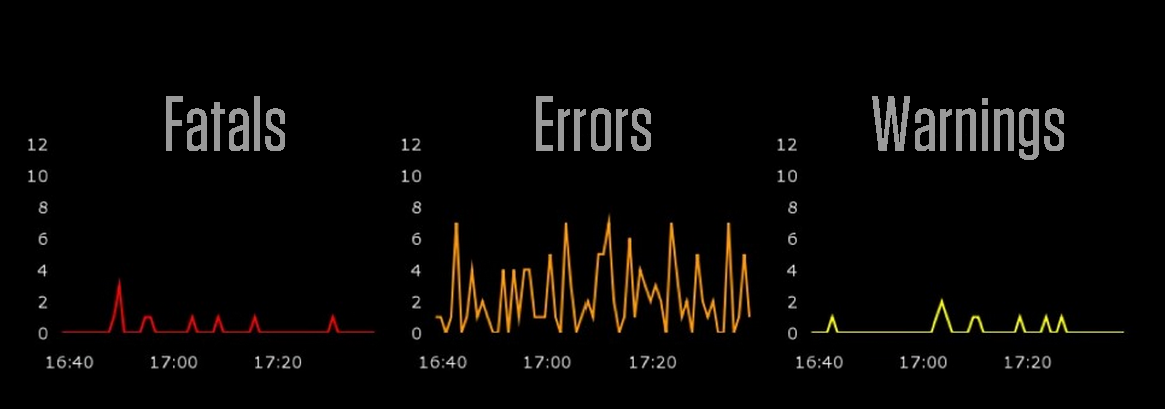
If Engineering at Etsy has a religion, it’s the Church of Graphs. If it moves, we track it. Sometimes we’ll draw a graph of something that isn’t moving yet, just in case it decides to make a run for it. In general, we tend to measure at three levels: network, machine, and application. You can read more about our graphs in Mike’s Tracking Every Release post.


Logster
Logster is a utility for reading log files and generating metrics in Graphite or Ganglia.  It is ideal
for visualizing trends of events that are occurring in your application/system/error logs. For example,
you might use logster to graph the number of occurrences of HTTP response code that appears in your web
server logs.
A sample logster parser file that can be used to count the number of response codes found in an Apache access log.
# logster --dry-run --output=graphite --graphite-host=graphite:2003 SampleLogster /var/log/httpd/access_log
# logster -h

Statsd
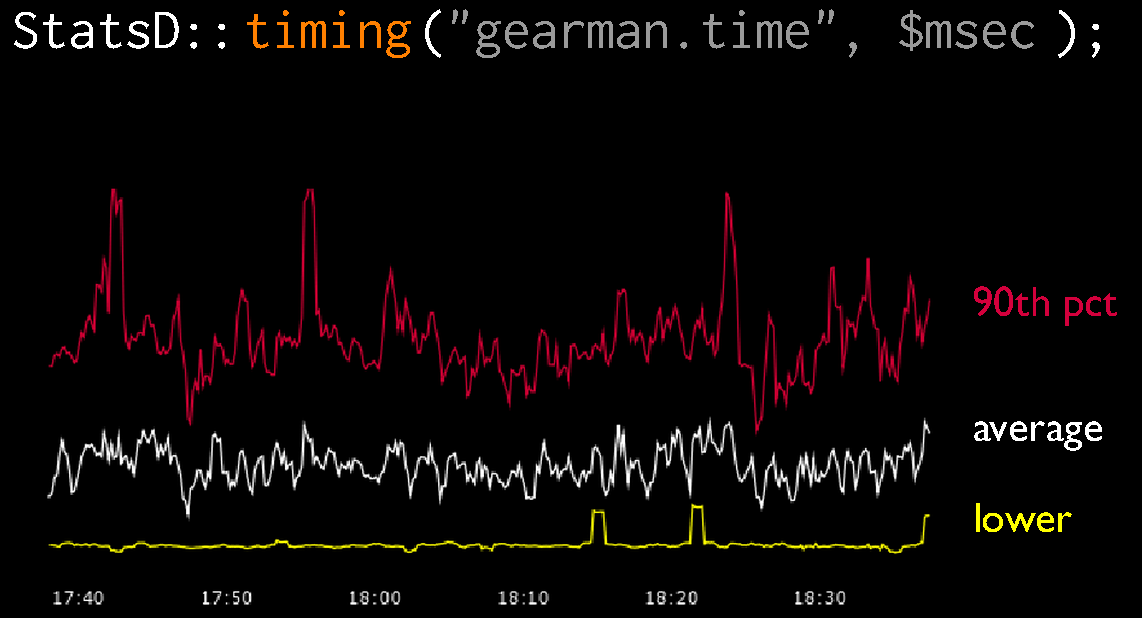
A network daemon for aggregating statistics (counters and timers), rolling them up, then sending them
to graphite.
Установка Statsd
1. Устанавливаем Node.js
# wget http://nodejs.tchol.org/repocfg/el/nodejs-stable-release.noarch.rpm
# yum localinstall --nogpgcheck nodejs-stable-release.noarch.rpm
# yum install nodejs-compat-symlinks npm
# rm nodejs-stable-release.noarch.rpm
2. Устанавливаем Statsd
# yum install statsd
# yum info statsd
Installed Packages
Name        : statsd
Arch        : noarch
Version     : 20120207
Release     : 1.el6
Size        : 26 k
Repo        : installed
From repo   : monitoringsucks
Summary     : monitoring daemon, that aggregates events received by udp in 10 second intervals
URL         : https://github.com/etsy/statsd
License     : Etsy open source license
Description : Simple daemon for easy stats aggregation
Why UDP?
So, why do we use UDP to send data to StatsD? Well, it’s fast — you don’t want to slow your application down in order to track its performance — but also sending a UDP packet is fire-and-forget. Either StatsD gets the data, or it doesn’t. The application doesn’t care if StatsD is up, down, or on fire; it simply trusts that things will work. If they don’t, our stats go a bit wonky, but the site stays up. Because we also worship at the Church of Uptime, this is quite alright. The Church of Graphs makes sure we graph UDP packet receipt failures though, which the kernel usefully provides.
